
Watch the oil tape long enough and a pattern repeats. West Texas Intermediate slides for days. Headlines announce cheaper barrels. Then you pull up to the pump and the number on the screen has barely moved — or has even gone up.
That is the seesaw.
One side of the board is crude oil, the raw commodity that traders quote in dollars per barrel. The other side is refined fuel — gasoline, diesel, jet — the products people actually buy. When the market is healthy, the two sides move together. When the bottleneck is not in the oil field but in the refinery and the pipes that connect it to stations, the board tips. Crude can get cheaper while the product you put in a tank stays expensive.
That is not a slogan. It is how the U.S. fuel system is built. And in 2026 it has been running in that mode for months.
Drivers feel the high side of the seesaw first. Crude is only part of the price on that screen.
The board is not a barrel. It is a machine.
Crude oil is almost useless in a car. It has to be distilled, cracked, treated, blended, moved, taxed, and retailed. Each of those steps has its own scarcity, its own cost, and its own pricing power.
The Energy Information Administration (EIA) decomposes the national average retail gasoline price into four pieces: crude oil, refining, distribution and marketing, and taxes. In a calm year, crude is usually about half the gallon. In tight product markets the refining slice swells. In May 2026, with the national average near $4.48 a gallon, EIA’s pump-component history put crude at 51.9 percent of the price — and refining at 21.7 percent, distribution and marketing at 14.8 percent, and taxes at 11.5 percent. Compare that with calmer months in late 2024 and early 2025, when refining’s share was often in the high single digits.
That is the first mechanical fact of the seesaw. If refining’s share of the gallon doubles, the pump can stay elevated even as the barrel cheapens.
ExxonMobil CEO Darren Woods put the same idea in operational language on CNBC: in the old world there was spare refining capacity, so pump prices were mostly set by crude. Today the constraint is refining itself. Product prices are being set by the demand for conversion, not by the supply of oil in the ground.
Watch that split explained in market terms:
What traders call the “crack” is the hinge of the seesaw
Refiners do not sell barrels of crude. They sell molecules. The industry’s shorthand for the profit of turning three barrels of crude into two barrels of gasoline and one barrel of diesel is the 3-2-1 crack spread.
In a typical year that spread lives in a band that looks boring: often $15–$25 a barrel. In mid-2026 it did not look boring. The NYMEX 3-2-1 printed near $70 a barrel — records, then new records. Diesel cracks on the U.S. Gulf and in New York Harbor have traded above $100 a barrel. As of late September 2026, NY Harbor diesel was still paying refiners on the order of $114 a barrel over WTI; Gulf Coast gasoline cracks were still in the $50–$67 range.
Read that again. At times this year, the processing step has been worth as much as, or more than, the barrel itself.
That is the seesaw in a single number. When crude is the scarce thing, the barrel’s price rises and the crack gets squeezed. When conversion capacity is the scarce thing, the barrel can sag and the crack explodes. Analysts have described the current cycle in exactly those terms: there is too much crude relative to the world’s ability to turn it into fuel.
The companies that own the conversion step have booked the result. Marathon Petroleum, Valero, and Phillips 66 together earned about $12.6 billion in the second quarter of 2026. Independent analyst Tom Kloza called gasoline cracks of $40–$50 and diesel cracks near $100 “out of the galaxy.” That is not a secret conspiracy memo. It is the public P&L of a tight product market.
Does that mean “energy companies use the seesaw”? In a narrow sense, yes: when the product market is tight they capture a wider spread, and they have no incentive to give that spread away faster than competition forces them to. In a broader sense, they did not invent the constraint. They inherited a refining system that has been shrinking, aging, and running into geopolitics at the same time.
The U.S. refining system is old, concentrated, and already redlined
As of January 1, 2025–2026, the United States had on the order of 132 operable refineries and about 18.0–18.4 million barrels per day of crude distillation capacity. That is less plant than the country had in the early 1980s, when there were roughly twice as many operating refineries. A new grassroots refinery of significant scale has not been built in the United States since 1976–1977. Capacity additions since then have mostly been bolt-ons and complexity upgrades at existing sites.
Utilization tells you how little slack is left. EIA weekly data show U.S. refiners running 97–98 percent of operable capacity in late August 2026 — one of only a handful of such prints since 2000 — before easing to 94 percent in the week ending September 18 as fall turnarounds began. The long-term average is closer to 90 percent. At 97–98 percent, there is almost no spare kettle. A heat wave that forces cutbacks for cooling, a hurricane in the Gulf, a power outage at a Midwest plant, or a deferred maintenance failure is enough to move regional prices.
The plants that remain are not sprinkled evenly across the map. More than half of U.S. refining capacity sits on the Gulf Coast (PADD 3) — Texas and Louisiana in particular. The East Coast has lost the majority of its throughput over two decades. The West Coast has been losing plants in real time: Phillips 66’s Los Angeles refinery closed in late 2025; Valero’s Benicia plant ceased refining in 2026. Those closures matter because the West Coast is poorly connected to Gulf product. California’s unique fuel spec makes substitution even harder. The result is a national average that hides a regional map: cheapest near the Gulf, structurally expensive on the West Coast.
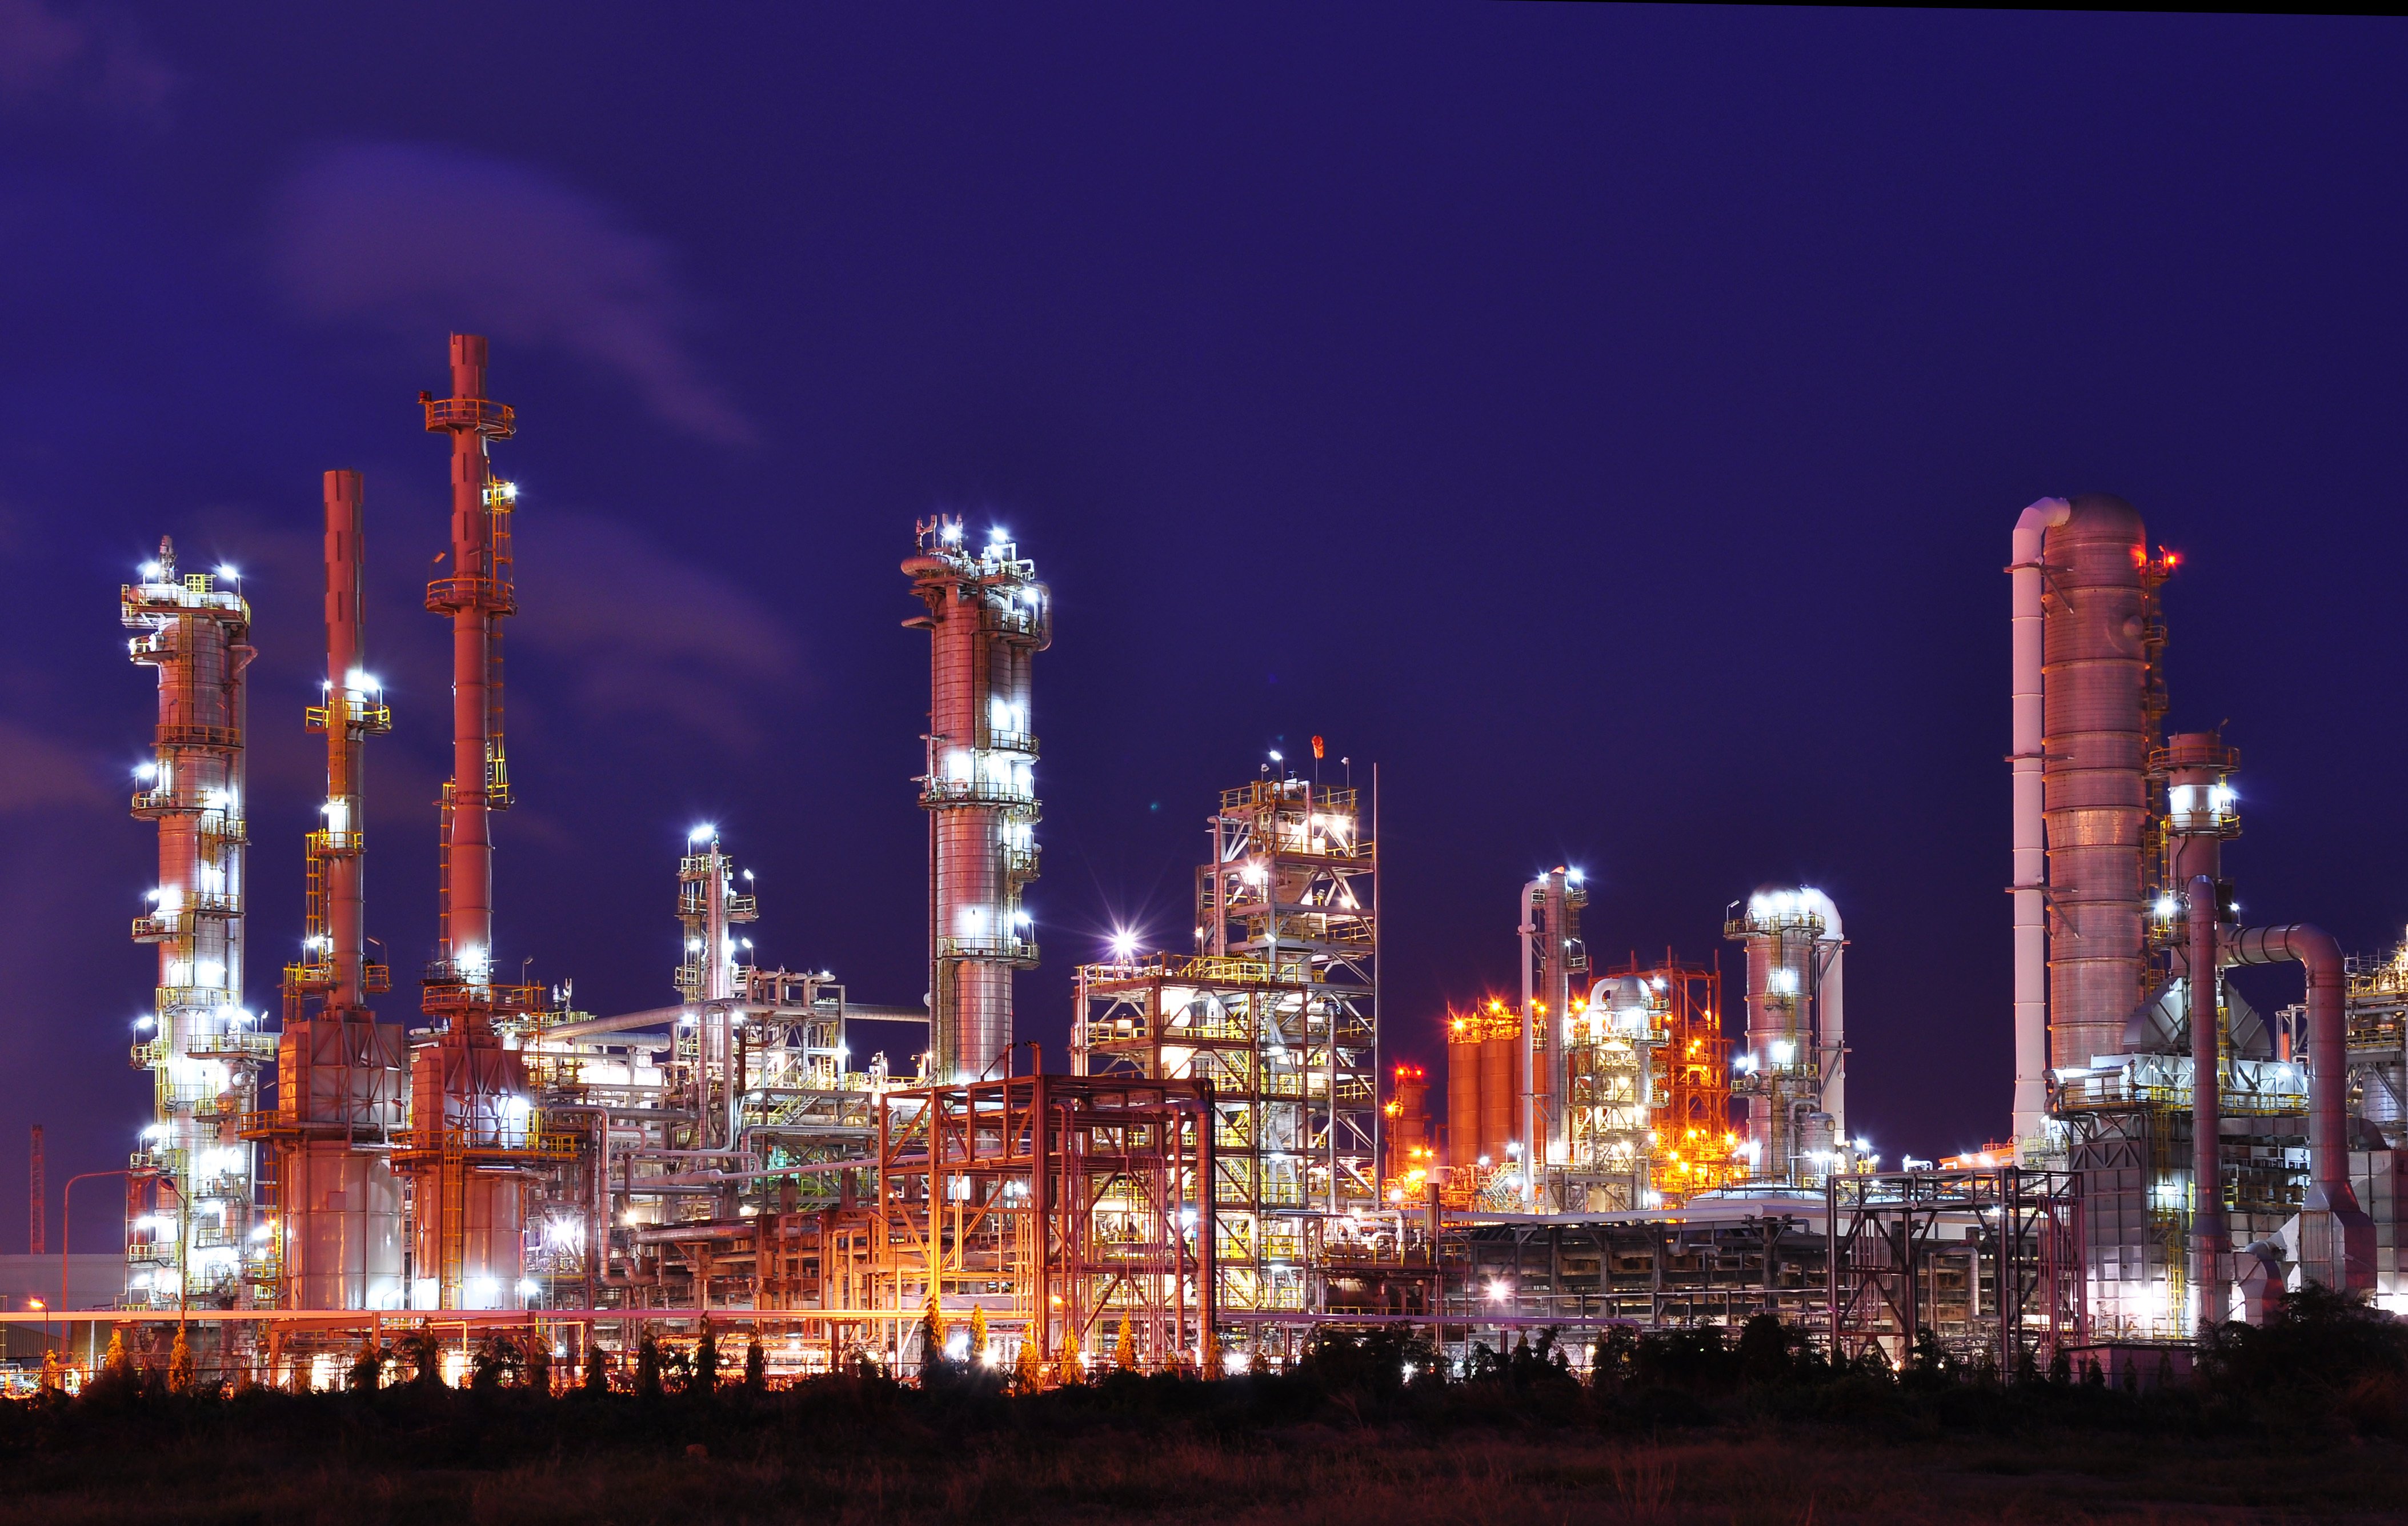
A modern U.S. refinery is a city of steel that cannot be “turned up” past the metallurgy and the permits. Utilization in the mid-to-high 90s is the system already doing that.
Infrastructure is the other side of the same problem
Even if every U.S. still has a spare distillation unit — it does not — molecules still have to move.
Pipelines and PADDs. The country is divided into five Petroleum Administration for Defense Districts. Product does not slosh freely among them. Colonial Pipeline is the East Coast’s aorta. The West Coast is an island in pipeline terms. When a California or Washington plant goes down, replacement barrels often have to come by marine tanker, which is slower and more expensive, and they have to meet a boutique specification.
The Cushing problem, inverted. Cushing, Oklahoma is the delivery point for WTI and a forest of tanks. Those tanks store crude. Finished gasoline and diesel are harder to stockpile for long periods. Strategic petroleum reserves are almost entirely crude. When a war or a strike takes product off the water, there is no equivalent product SPR to dump into the market. That is one reason crude can be well supplied while diesel inventories sit 10–14 percent below their five-year seasonal average.

Cushing can be awash in crude and the pump can still be tight. Storage of the raw barrel is not storage of the finished gallon.
The light-sweet / heavy-sour mismatch. This is the quiet infrastructure fact that surprises people. The shale boom produced a flood of light, sweet crude. A large share of U.S. refining kit — especially older Gulf and California plants — was built to run heavy, sour barrels from places like Canada, Mexico, and the Middle East, using cokers and desulfurization units. The workaround has been a two-way trade: export light sweet, import heavy sour. About 95 percent of recent U.S. crude exports have been light sweet; about 90 percent of crude imports have been heavy sour. That lockstep with the world price is why a disruption on the other side of the planet still shows up in a Midwestern gallon even when the United States is a net petroleum exporter.
Last-mile trucks. Most of the branded stations you see are not owned by Exxon, Chevron, or Shell. Major oil companies own a small single-digit share of retail outlets. The last owner in the chain is usually an independent dealer who prices off replacement cost — what the next tanker will cost — not off the crude quote on CNBC. When wholesale racks stay high, so does the street.
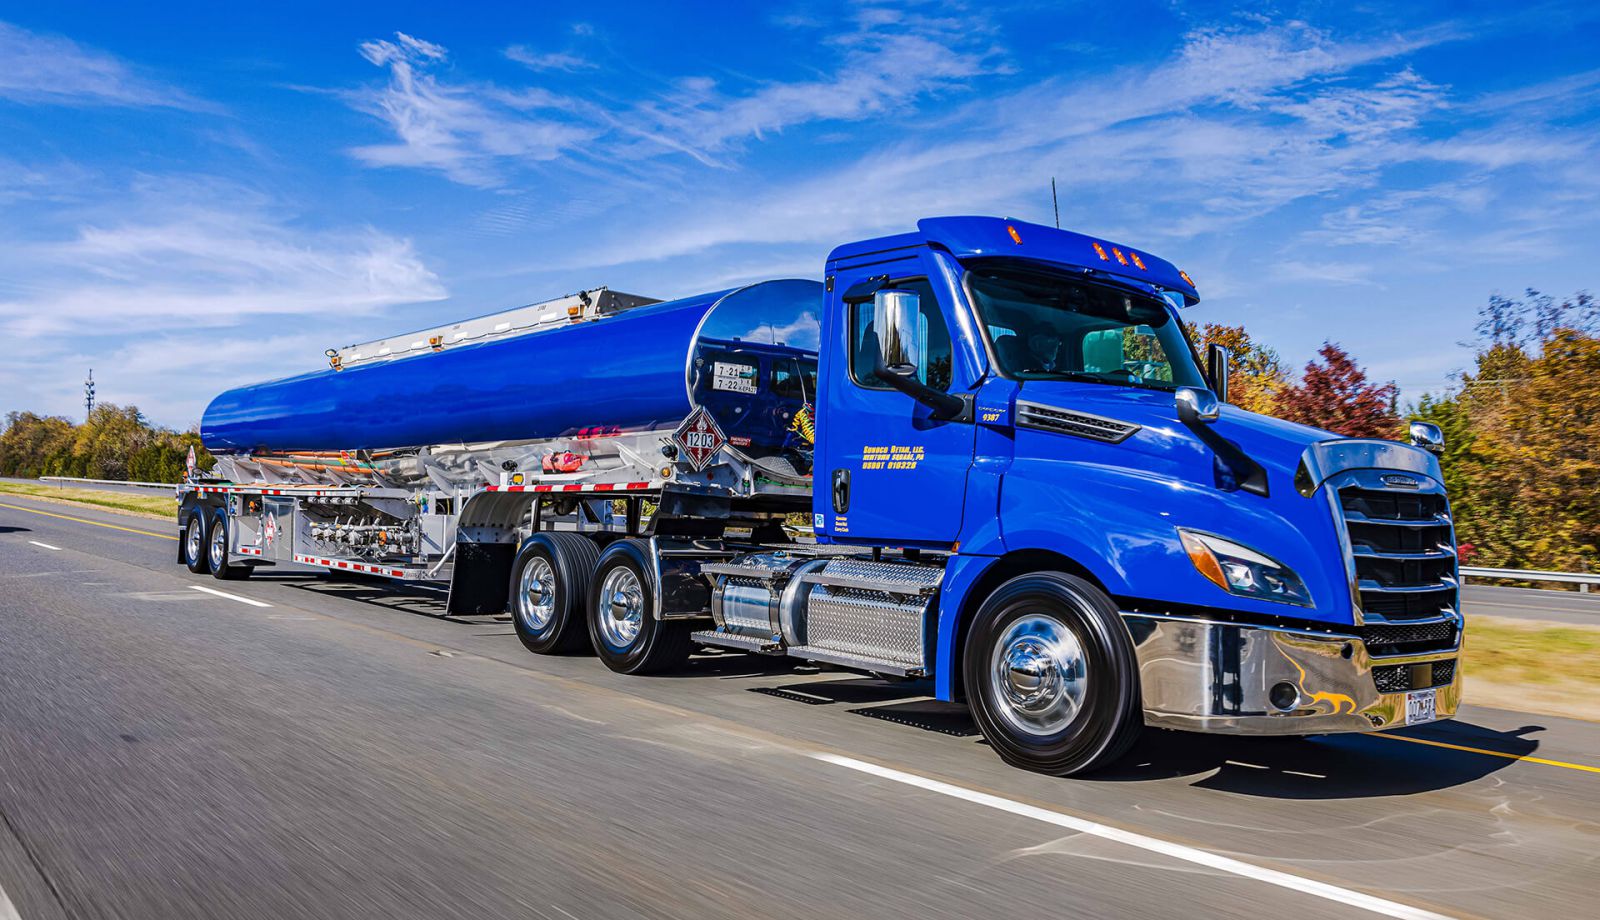
The last mile is a tanker and an independent dealer, not a ticker symbol. That is why crude can fall on Monday and the neighborhood station can still be selling last week’s wholesale.
2026’s extra weight on the product side of the board
A tight refining system is a chronic U.S. condition. This year added an acute global one.
Industry executives and the IEA have described on the order of 5 million barrels per day of global refining capacity offline or impaired — a combination of Iranian strikes and Hormuz-related disruption around Gulf export refineries, Ukrainian drone attacks that pushed Russian processing to multi-decade lows and triggered a Russian diesel-export ban, and Chinese export restraint. Global refineries processed about 5.1 million barrels a day less in the second quarter of 2026 than a year earlier. Valero’s COO and Phillips 66’s marketing chief both said the product market was tightening, not loosening, even as crude headlines improved.
That is why diesel has been the uglier half of the seesaw. Diesel and jet are the workhorse middle distillates. They move freight, harvests, and aircraft. You cannot easily “make more diesel” by wishing it out of a gasoline-oriented yield slate, especially when the incremental crude on offer is light shale that naturally makes more naphtha and gasoline than distillate. When distillate is the scarce cut, its crack can trade through the price of crude itself. That is what happened in parts of 2026.
A concise news wrap of the same divergence:
And a market-desk version of why product has not followed crude down:
Rockets, feathers, and the calendar inside the pipe
Even in a normal year, retail gasoline does not track crude one-for-one, and it does not track it symmetrically.
Economists have a name for the asymmetry: rockets and feathers. Prices rise like a rocket when crude jumps and fall like a feather when crude eases. The St. Louis Fed, looking at 2026 data, estimated that even if oil had fully returned to pre-war levels by mid-July and stayed there, it could take on the order of six months for retail gasoline to get back within a quarter of its pre-conflict level. EIA’s long-standing rule of thumb is roughly 2.4 cents per gallon at the pump for every $1 move in the barrel — and that coefficient itself changes with season and direction.
Why the lag is structural:
- Inventory in the system. The gasoline in a station’s underground tanks was refined from crude bought days to weeks earlier. Cheaper crude has to be purchased, processed, shipped on a product pipeline or barge, batched at a terminal, and trucked. That is a two-to-six-week conveyor, not a light switch.
- Replacement-cost pricing. Stations and wholesalers price the next load, not the last one. If the rack is still high, the street stays high even if the WTI print looks friendly.
- Search behavior. When prices are rising, drivers shop. When prices are falling, they shop less. That reduces competitive pressure on the way down. Stanford economist Neale Mahoney has described this as part of the rocket-and-feather pattern.
- Seasonal chemistry. Summer-blend gasoline is more expensive to make. Fall turnarounds take units offline just as distillate demand for heating and harvest rises. The calendar inside the refinery does not care that crude had a down week.
None of that requires a smoke-filled room. It does mean that “oil is down today” is a poor forecast of “my fill-up is cheaper this afternoon.”
Is this gouging, or is this a bottleneck with a profit attached?
This is where the argument usually turns political, and where the honest answer is “both things can be true in different layers.”
The bottleneck is real. Utilization near 98 percent, a net loss of U.S. plants since 2020, no new major U.S. refinery in half a century, West Coast isolation, a crude-quality mismatch, and several million barrels a day of overseas refining knocked out by war are not talking points. They show up in inventories, in freight rates, and in the fact that U.S. refiners have been exporting record product into a world that is short gasoline and especially diesel. Ban those exports and Gulf crackers would glut, margins would collapse, and — as CSIS and others have warned — refiners would cut runs, which can reduce total domestic supply after the first inventory bulge.
The profit is also real. When the constraint is refining, the companies that own refineries earn windfall cracks. That is what a price signal is supposed to do: pay the scarce asset. It is also what infuriates households, because the scarce asset is a plant that takes a decade and billions of dollars to build, not a well that can be drilled in months. Refiner equities have dramatically outperformed upstream producers in this cycle for exactly that reason.
Retail is a third layer. API and independent analysts have pointed out that integrated majors own a small share of stations. Local dealers can be slow to lower street prices because they are protecting margin on inventory they already paid for. “Rise like a rocket, fall like a feather” is older than this war. It is also why blaming only “Big Oil” or only “the station on the corner” is usually too small a story.
The cleanest sentence in the 2026 debate came from several directions at once: the world did not lose crude. It lost the machinery that turns crude into diesel and gasoline. That is the seesaw.
Why “just build more refineries” is a slogan, not a 2026 solution
A new world-scale U.S. refinery is a ten-year, ten-figure project facing air permits, water permits, community opposition, climate litigation, and a demand outlook that every board treats as uncertain past 2035. Executives have said as much on earnings calls: they will not sanction a multi-billion-dollar atmospheric crude unit on the assumption that Russian and Middle Eastern plants stay broken. They will run the plants they have at 96–98 percent, defer some maintenance while the crack is this wide, and harvest the cycle.
What actually rebuilds the cheap side of the seesaw, in order of speed:
- Global plants returning. Russian and Gulf refining coming back is the single biggest product-supply event on the calendar. It is not a U.S. policy lever.
- Inventories rebuilding. Distillate and gasoline stocks have to climb back toward seasonal norms before cracks compress.
- Demand easing. Harvest, hurricane rebuilds, and winter heat compete with diesel. A warm winter or a freight slowdown would do more to the pump than a $5 move in WTI.
- Debottlenecking, not new grass-roots plants. Incremental hydrocracker, coker, and alkylation capacity at existing Gulf sites is how the U.S. has added barrels for forty years.
- Infrastructure that actually moves product. More product pipe out of the Gulf, more marine dock capacity, and fewer boutique specs would shrink regional spikes. Those projects are also slow.
Until those things happen, cheaper crude is a necessary condition for cheaper fuel. It is not a sufficient one.
How to read the market from here
If you only watch WTI, you will keep being surprised. Watch four other dials.
1. Utilization. Mid-90s is tight. High-90s is no cushion. Fall turnaround season can drop utilization and, paradoxically, tighten products further if too many units come down at once.
2. The crack, not the barrel. A falling WTI with a $100 diesel crack is a product shortage. A falling WTI with a $15 crack is a demand problem.
3. Distillate inventories versus the five-year band. Gasoline gets the headlines. Diesel is the tell.
4. Regional basis. Gulf Coast versus New York Harbor versus Los Angeles. A national average hides the infrastructure map.
The seesaw is not a trick energy companies invented last spring. It is what a high-utilization, regionally fragmented, quality-mismatched refining system looks like when the rest of the world’s conversion capacity is also on fire. Crude can print lower every morning. Until the plants, the pipes, and the product tanks catch up, the other end of the board stays up.
That is why the barrel can fall daily and the gallon can still feel expensive. The shortage moved downstream. The price did too.